Machine Learning Model Doubles Accuracy of Global Landslide 'Nowcasts'
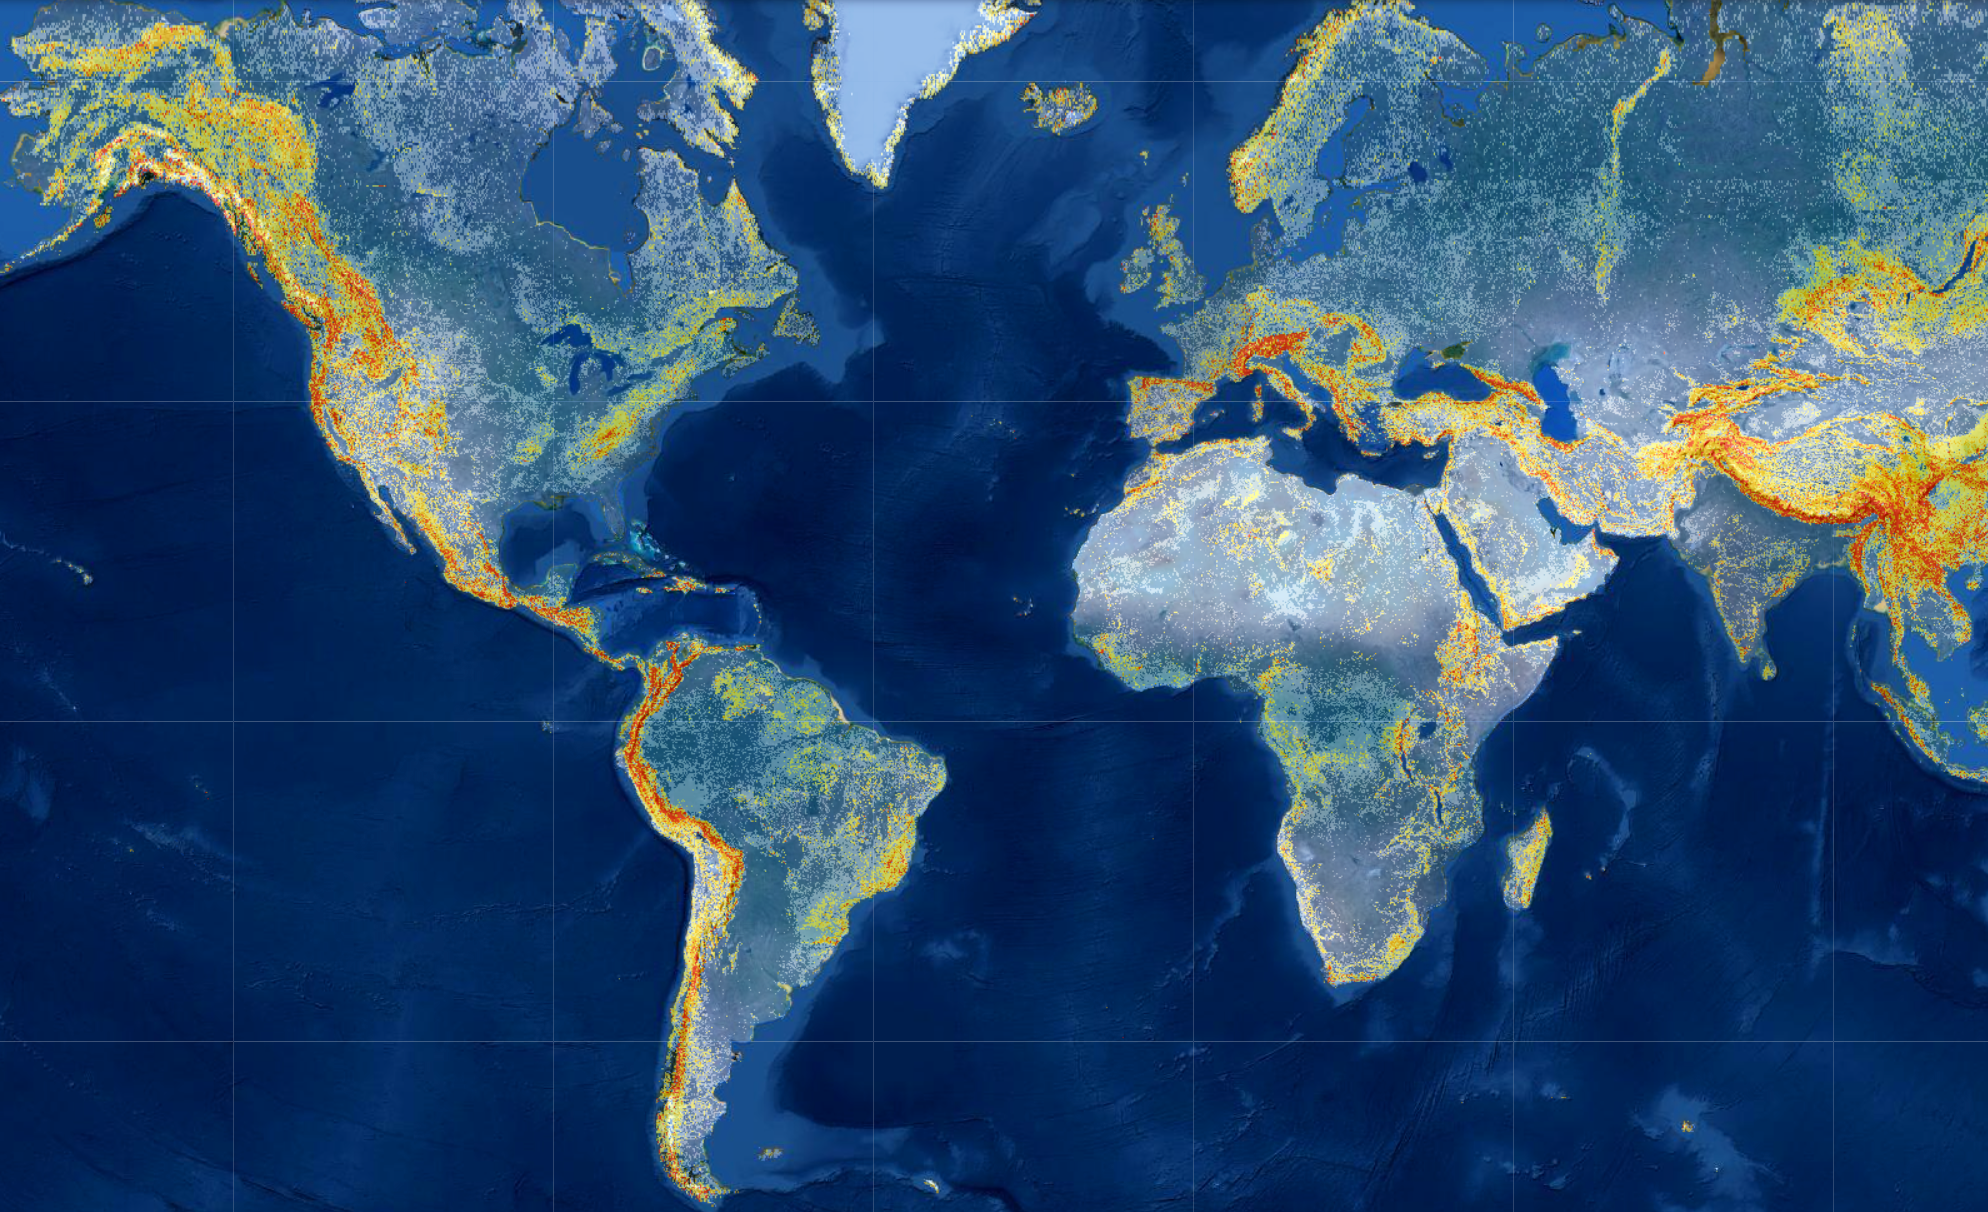
The model processes all of this data and outputs a probabilistic estimate of landslide hazard in the form of an interactive map, said Thomas Stanley, Universities Space Research Association scientist at NASAs Goddard Space Flight Center in Greenbelt, Maryland, who led the research. This is valuable because it provides a relative scale of landslide hazard, rather than just saying there is or is not landslide risk. Users can define their area of interest and adjust the categories and probability threshold to suit their needs.In order to teach the model, researchers input a table with all of the relevant landslide variables and many locations that have recorded landslides in the past. The machine learning algorithm takes the table and tests out different possible scenarios and outcomes, and when it finds the one that fits the data most accurately, it outputs a decision tree. It then identifies the errors in the decision tree and calculates another tree that fixes those errors. This process continues until the model has learned and improved 300 times.The result is that this version of the model is roughly twice as accurate as the first version of the model, making it the most accurate global nowcasting tool available, said Stanley. While the accuracy is highest often 100% for major landslide events triggered by tropical cyclones, it improved significantly across all inventories.Version 1, released in 2018, was not a machine learning model. It combined satellite precipitation data with a global landslide susceptibility map to produce its nowcasts. It made its predictions using one decision tree largely based on rainfall data from the preceding week and categorized each grid cell as low, moderate, or high risk.In this new version, we have 300 trees of better and better information compared with the first version, which was based on just one decision tree, Stanley said. Version 2 also incorporates more variables than its predecessor, including soil moisture and snow mass data.Generally speaking, soil can only absorb so much water before becoming saturated and, combined with other conditions, posing a landslide risk. By incorporating soil moisture data, the model can discern how much water is already present in the soil and how much additional rainfall would push it past that threshold. Likewise, if the model knows the amount of snow present in a given area, it can factor in the additional water entering the soil as the snow melts. This data comes from the Soil Moisture Active Passive (SMAP) satellite, which is managed by NASAs Jet Propulsion Laboratory in Southern California. It launched in 2015 and provides continuous soil moisture coverage.LHASA Version 2 also adds a new exposure feature that analyzes the distribution of roads and population in each grid cell to calculate the number of people or infrastructure exposed to landslide hazards. The exposure data is downloadable and has been integrated into the interactive map. Adding this type of information about exposed roads and populations vulnerable to landslides helps improve situational awareness and actions by stakeholders, from international organizations to local officials.Building on years of research and applications, LHASA Version 2 was tested by the NASA Disasters program and stakeholders in real-world situations leading up to its formal release. In November 2020, when hurricanes Eta and Iota struck Central America within a span of two weeks, researchers working with NASAs Earth Applied Sciences Disasters program used LHASA Version 2 to generate maps of predicted landslide hazard for Guatemala and Honduras. The researchers overlaid the model with district-level population data so they could better assess the proximity between potential hazards and densely populated communities. Disasters program coordinators shared the information with national and international emergency response agencies to provide better insight of the hazards to personnel on the ground.While it is a useful tool for planning and risk mitigation purposes, Stanley says the model is meant to be used with a global perspective in mind rather than as a local emergency warning system for any specific area. However, future research may expand that goal.We are working on incorporating a precipitation forecast into LHASA Version 2, and we hope it will provide further information for advanced planning and actions prior to major rainfall events, said Stanley. One challenge, Stanley notes, is obtaining a long-enough archive of forecasted precipitation data from which the model can learn.In the meantime, governments, relief agencies, emergency responders, and other stakeholders (as well as the general public) have access to a powerful risk assessment tool in LHASA Version 2.To learn more and to access the current map, please visit:https://landslides.nasa.gov/viewer
……Technology

One-stop lifestyle app dedicated to making life in Singapore a breeze!


 English
 简体中文
简体中文
Comments
Leave a comment in Nestia App